Continuity
Outages drain the site batteries
Back-to-back outages flatten the DC battery strings and lean on generators that need fuel, servicing and a visit.
 AMPROTEQ
A network is only as good as its worst site in an outage. Storage carries exchanges, hub sites and fibre POPs through load-shedding, runs the middle of the day on its own solar and puts every site on one screen.
Back-to-back outages flatten the DC battery strings and lean on generators that need fuel, servicing and a visit.
Rectifiers and air-conditioning run around the clock, so every peak window is billed at full load.
Exchanges, hub sites and POPs are spread across a region, and every fuel run and callout costs time and money.
| Systems | APEX A1000 + PULSE P500 per exchange; HELIOS H250 for roof and carport solar |
| Connection | 400 V, through a PULSE P500 on the critical board |
| Duration | 2 to 4 hours, set by the outage you plan for |
| Pairs with | The rectifier plant and its battery strings, standby sets |
| Commercial model | Purchase, site by site or as a fleet |
Every configuration is sized from the site's own interval data and tariff; this is a starting point, not a quote.
The four-page sector brief, on the page: what an exchange pays for in Eskom’s peak windows, the system we put ahead of its rectifiers, what happens in the ten milliseconds after the grid goes, and what it returns.
Download the flyerAn exchange draws almost as much at 03:00 as at 18:00, so it buys a full share of its energy in Eskom’s peak windows. The roof covers the middle of the day; the A1000 carries the peaks.
The white line is grid draw with an A1000 behind a PULSE P500 and 280 kWp of roof and carport solar (gold, dashed): close to zero in the morning peak, cut by three quarters in the evening one, and held under a 420 kW ceiling while the sun and the grid refill the battery between the peaks.
Active energy, transmission zone 0. A kilowatt-hour bought off-peak (123 c) and spent in a winter peak (739 c) saves about five times what it cost, after losses.
| Site | Draws | Fit |
|---|---|---|
| Macro tower | 2 – 8 kW, 48 V DC | Keeps its own batteries |
| Hub site · fibre POP | 100 – 200 kW | Resilience first |
| Regional exchange | 200 – 300 kW | Peaks and backup |
| Core exchange · MSC | 300 – 500 kW | Full value |
| Data centre | 1 MW and up | APEX + NEXUS, at MV |
A single tower draws a few kilowatts and keeps its 48 V batteries. The A1000 is for sites that draw hundreds.
The −48 V plant and its strings stay exactly as they are. PULSE and the A1000 work on the AC side with the roof on HELIOS, and Solaris™ EMS runs all three and puts every site on one screen in the NOC.
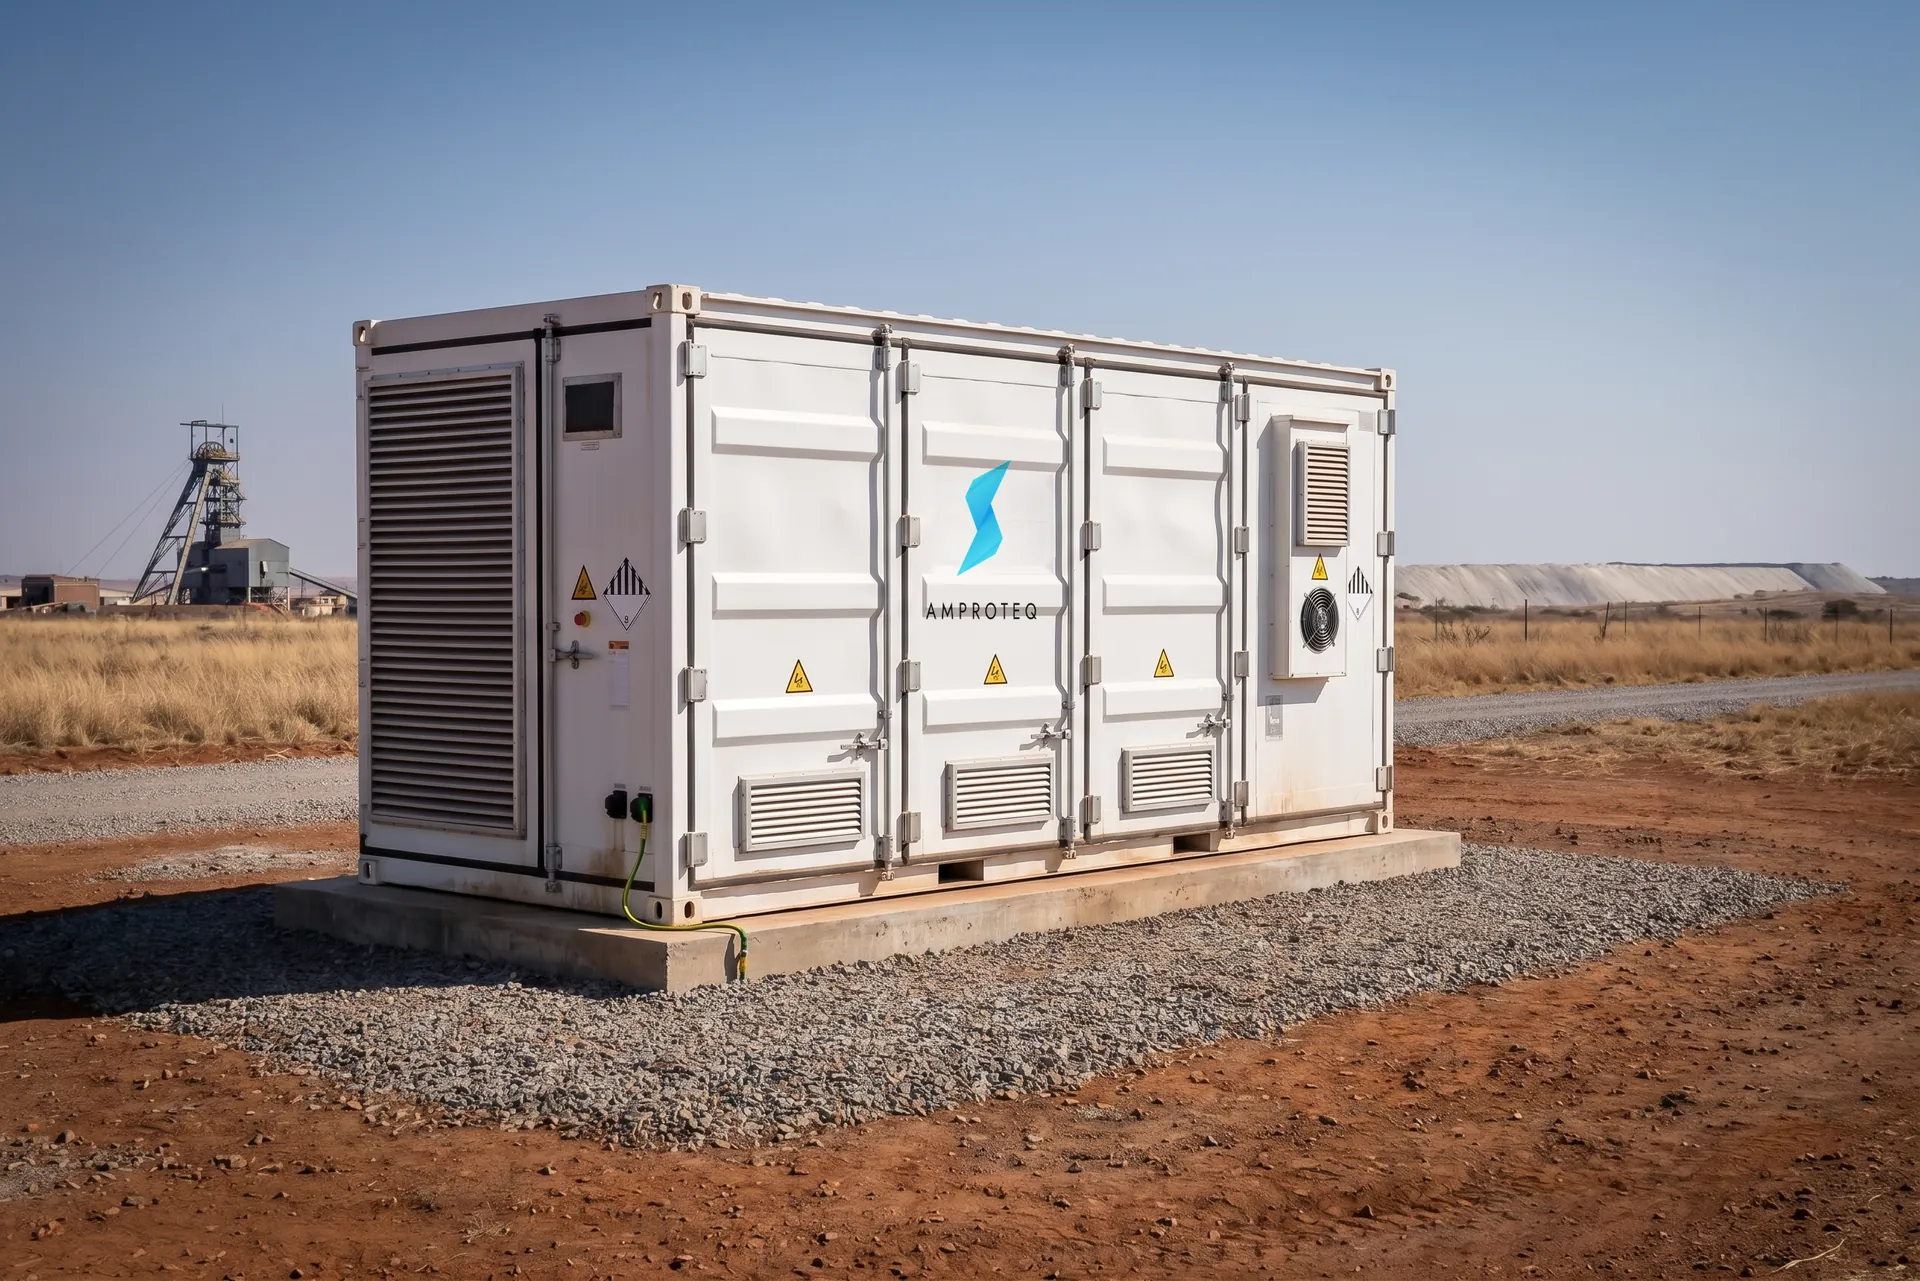
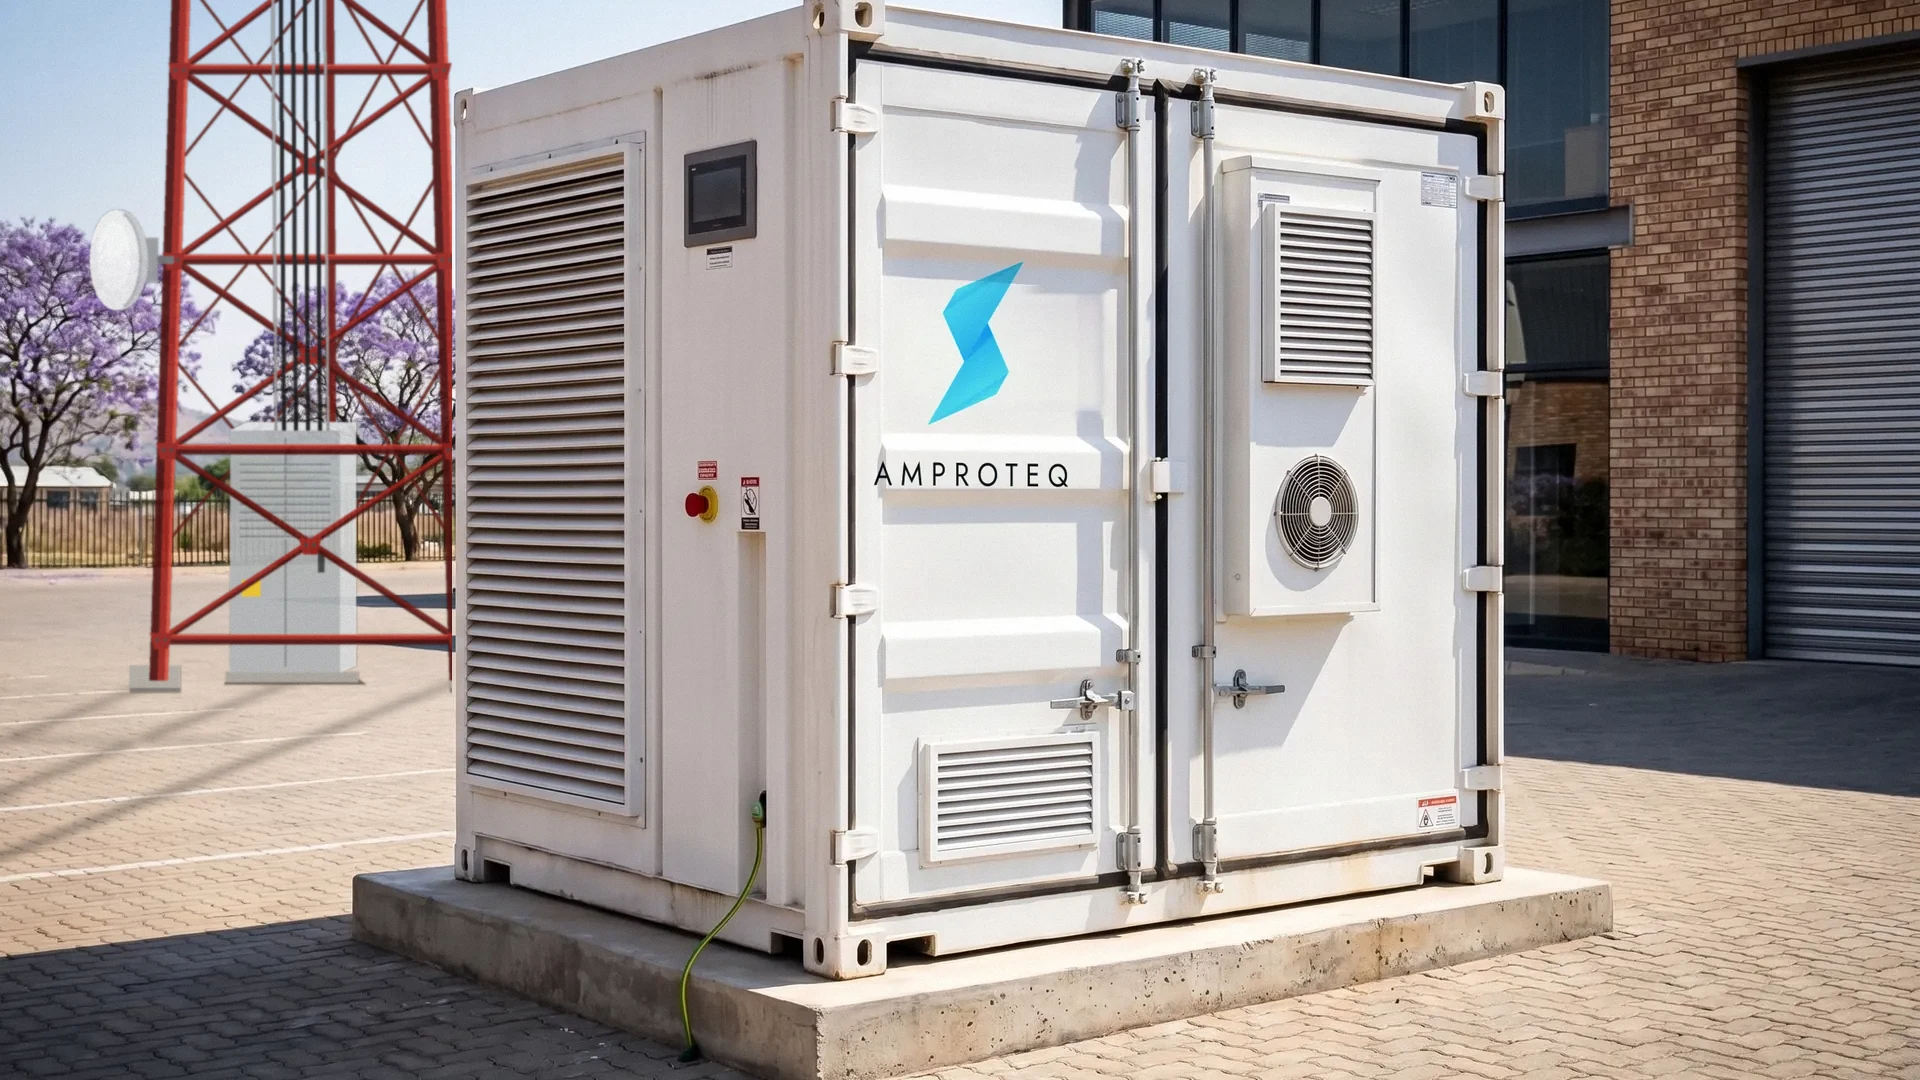
Battery, PCS, cooling and fire protection in one 10 ft container, tested before dispatch.
A static switch between the supply and the site: grid and set ahead, battery and load behind.
Roof and carport PV straight onto the A1000’s DC bus, in one conversion. Sold only with the battery.
The UPS, the strings and the set keep their jobs. The battery adds a layer between the first millisecond and the first litre of diesel.
PULSE moves the 400 V board to the battery in ≤ 10 ms, inside the 20 ms that rectifiers and IT power supplies ride through.
A full A1000 carries a 344 kW core exchange for about 2.7 hours, and longer in daylight while the roof keeps feeding it.
The rectifiers never lose their AC supply, so the −48 V batteries stay full for the outage they were sized for.
Most interruptions end before the battery runs down. The set starts only when an outage outlasts it, and fewer starts mean fewer refuels to guard.
Figures for one modelled core exchange, at an indicative turnkey cost. Across a 16-site roll-out: payback in less than six years, a 24 % IRR and 4.7× returned. Diesel saved is on top.
Turnkey supply, install and commissioning, site by site. You own the plant; we run it under a 15-year O&M and availability agreement.
We own and run the plant for a fixed monthly fee per site, for operators who keep storage off the balance sheet.
Start with the sites that pay back first, on one design standard, and add sites as the programme proves itself.
Illustrative case · composite site · not a client project
The eight-page business case, on the page: a mobile operator’s 16 highest-draw exchanges, with one composite core exchange on the Gauteng Highveld modelled half-hour by half-hour for a year on Eskom’s 2026/27 Miniflex tariff, then carried over fifteen years.
Download the business caseThe modelled core exchange runs every hour of the year. Its bill is R7.1 m, and 32 % of the energy cost is bought in 14 % of the hours.
Illustrative case · composite site · not a client project
| Operation | Core exchange + switching centre |
| Region | Gauteng Highveld |
| Supply | 400 V, Eskom mini-substation |
| Tariff | Miniflex Mi01N, zone 0 |
| Network load | ≈ 255 kW, round the clock |
| Average draw | 344 kW · peak 411 kW |
| Notified demand | 500 kVA |
| Recorded peak | 432 kVA |
| Standby | 500 kVA diesel set |
| Roof and yard | ≈ 990 m² of flat roof, 40 bays |
| Annual energy | 3.01 GWh |
| Annual bill | R7.1 m ex VAT |
Peak energy costs more than all off-peak energy, in a seventh of the hours. It is the line the battery attacks.
The rectifier plant and the core IT set a floor that never moves. Cooling adds the swing on summer afternoons.
Each column is a day from April 2026 to March 2027, each row a half-hour. The network never sleeps: the brighter afternoons are the cooling plant in the Highveld summer, the weekday blocks are staff and lighting, and the floor of about 300 kW is there at 03:00 on a Sunday.
Cut the peak bill and the set’s running hours, use the roof, and leave the −48 V plant and the network alone.
One 400 V board, no medium-voltage room, a yard of a few square metres, and a site that cannot go dark during the works.
Cable theft and network faults: every interruption is a set start, and every refuel is diesel worth stealing.
The network draws the same at 03:00 as at 18:00, with a small swell when traffic peaks in the evening. Cooling adds the swing on top, and the sun on the roof arrives in the standard hours between the peaks.
Illustrative case · composite site · not a client project
77 % of the load is the network itself, on the rectifiers and core IT. It cannot be shifted or switched off, only supplied differently.
The same kilowatt-hour costs R7.39 in a June peak and R3.07 in a November one, so 44 % of the year’s peak bill falls in three months.
The arrays peak near 235 kW against a daytime floor of 314 kW, so every kilowatt-hour is used on site and nothing is exported.
PULSE goes between the supply and the exchange board; the A1000 sits behind it, and HELIOS puts the roof and carport arrays straight onto its DC bus. The rectifiers and the network see nothing new.
Illustrative case · composite site · not a client project
| Battery | APEX A1000, 1 044 kWh · 940 usable |
| Conversion | 4 × 125 kW PCS inside · ≥ 88 % AC–AC |
| Solar | 180 kWp roof + 100 kWp carport |
| Solar input | HELIOS H250, DC onto the battery bus |
| Transfer | PULSE P500, ≤ 10 ms static switch |
| Connection | 400 V, ahead of the exchange board |
| Control | Solaris™ EMS, Solaris Cloud to the NOC |
| Footprint | ≈ 6 × 5 m of yard, plus roof and carport |
| Option | Sites | Average draw | Cycles / yr | Gross saving | Payback | NPV |
|---|---|---|---|---|---|---|
| Core · A1000 only | — | 344 kW | 393 | R952 k | <6 yrs | R3.8 m |
| Core · + 180 kWp roof | — | 344 kW | 374 | R1 549 k | <6 yrs | R7.5 m |
| Core · + 280 kWp roof and carport ◆ | 6 | 344 kW | 369 | R1 884 k | <6 yrs | R9.2 m |
| Regional · + 160 kWp | 10 | 232 kW | 301 | R1 297 k | <6 yrs | R5.0 m |
| Hub · + 100 kWp | — | 136 kW | 175 | R783 k | <9 yrs | R0.8 m |
Solar lifts the core site’s NPV 2.4-fold. Regional exchanges take a smaller array and pay back a little later; hub sites under 200 kW use half the battery, so there resilience is the reason. ◆ Modelled in detail.
Solaris carries the morning peak on the battery, lets the roof carry midday while the battery refills under a 420 kW ceiling, then carries the evening peak. It never spends the last 15 %: that is for the next fault.
Illustrative case · composite site · not a client project
Gold: solar from the roof and carport. Between the peaks most of it refills the battery through HELIOS (lower strip) while the grid carries the site under the ceiling. Cyan: energy the battery supplies. Grey: energy bought to recharge, off-peak or in the standard hours. Lower strip: battery power (±500 kW) and state of charge, reserve included.
51 % of the saving is the roof, which never exports. The rest is the battery moving the peaks onto cheaper hours, net of what it buys back, and a smaller NMD.
Illustrative case · composite site · not a client project
| Line | How it is earned | Per year |
|---|---|---|
| Solar | 447 MWh a year from 280 kWp, all used on site in the daylight hours | R1 001 k |
| Winter peaks | June – August, 06:00 – 08:00 and 17:00 – 20:00, carried on stored energy | R740 k |
| Summer peaks | The rest of the year, 07:00 – 09:00 and 18:00 – 21:00 | R852 k |
| Refill | Bought back off-peak and in the standard hours, losses included | −R654 k |
| Notified demand | Renewed at 450 kVA from year two: the sun takes the top off the midday draw | R39 k |
| Power factor | PCS holds 0.99 at the bus; the high-season reactive charge falls away | R3 k |
| Bill saving, full year | R1 980 k | |
| Counted in year one | At 97 % availability, as in the fifteen-year cash flow | R1 880 k |
Bills are rebuilt line by line from the Miniflex schedule (< 500 V, zone 0). Solar is PVGIS 5.3 hourly data for Johannesburg with 14 % system loss and no export. Savings are taken at 97 % availability; the NMD saving starts in year two. Diesel saved is not counted.
The operator buys 16 sites turnkey, battery, switch and solar, and we run them. The saving rises with the tariff and eases as cells and panels age; O&M is the only cost after day one.
Illustrative case · composite site · not a client project
Even the worst single case leaves an NPV of R69 m.
On the cell maker’s measured curve at 1.01 cycles a day; each year’s saving uses the energy left that year. Panels lose 0.5 % a year.
| Structure | Turnkey supply, install and commissioning |
| Ownership | The operator, site by site |
| O&M | 15-year service agreement, AMPROTEQ |
| Availability | ≥ 97 %, measured monthly |
| Capacity | Battery tested yearly; solar yield monthly |
| Augmentation | None planned: ageing is in the model |
| Monitoring | Solaris Cloud, 24 / 7, into the NOC |
| Alternative | Service agreement: fixed fee per site |
PULSE moves the board to the battery in under ten milliseconds. On a published interruption Solaris holds the charge; on a fault it spends what it has, and the set starts only if the outage outlasts the battery.
Illustrative case · composite site · not a client project
Solaris spends only the surplus in the first peak hour, then the battery carries all 337 kW of the exchange from 18:00 to 20:00. The set never starts: about 190 litres and one start saved for every slot like it.
Interruptions are an assumption for a site with cable-theft exposure: 24 a year, from 15 minutes to 10 hours, each carried on whatever charge the dispatch has left; in daylight the roof keeps feeding the battery through HELIOS.
Generic set fuel curve, at the core exchange; at R22 a litre the diesel is worth ≈ R47 k a year here. Not counted in the payback.
| Work on a live exchange | The PULSE bypass carries the board through one planned cut-over |
| Diesel and cable theft | Fewer refuels; the A1000 is locked, alarmed and watched from the NOC |
| Cell ageing | Measured curve in the model; capacity tested every year |
| Solar approval | No export; HELIOS sits on the battery’s DC bus, behind the switch |
Illustrative case on composite sites; not a client project and not an offer. Modelled with Eskom’s Schedule of Standard Prices 2026/27 (Miniflex, < 500 V, zone 0), PVGIS 5.3 solar data and APEX A1000 / PULSE P500 / HELIOS H250 ratings. Tariff escalation beyond 2027/28, the installed cost, the outages, the set fuel curve and all site data are assumptions.
The brief is the four-page case for solar and storage at an exchange. The case study runs the numbers on sixteen modelled exchanges, half-hour by half-hour, on the 2026/27 Miniflex tariff.


Illustrative case · composite site · not a client project
Figures in both documents are modelled on Eskom’s 2026/27 Miniflex schedule (below 500 V) and indicative costs. A site proposal replaces every one with numbers from your own data.
Twelve months of interval data, your tariff schedule and your notified maximum demand are enough for a first sizing and an indicative capex, within five working days, at no cost.