Continuity
Every outage is a temperature excursion
Chilled and frozen stock can only warm for so long before it is written off, and the gensets that cover the gap burn diesel.
 AMPROTEQ

A cold store sells temperature, around the clock. Storage carries the compressors through an outage, moves their load out of the peak windows and holds the demand charge that defrost and pull-down spikes set.
Chilled and frozen stock can only warm for so long before it is written off, and the gensets that cover the gap burn diesel.
Refrigeration runs day and night and works hardest in the hot afternoon and evening, overlapping the evening peak window.
Defrost cycles, door traffic and the pull-down after an outage can set the month's maximum demand on their own.
| Systems | A2000, or A1000 blocks in 1 MWh steps; A3000 to A5000 with an MV skid on large stores |
| Connection | 400 V on the refrigeration board, or MV through a NEXUS skid |
| Duration | 2 hours for the bill; 4 hours where backup matters as much |
| Pairs with | Rooftop PV, existing gensets, a PULSE cabinet for the island |
| Commercial model | Purchase, with a 15-year O&M agreement; a service agreement as the alternative |
Every configuration is sized from the site's own interval data and tariff; this is a starting point, not a quote.
The four-page sector brief, on the page: what a compressor costs by the half-hour, the system we put on your cold boards, how the chambers ride through an outage, and what it returns.
Download the flyerThe compressors never stop, and they work hardest in the afternoon and evening. The value sits in five peak hours a weekday, and in the one half-hour a month that sets the demand charge.
The white line is grid draw with 2 APEX A2000: well down through both peak windows, under the 1 890 kW July ceiling in peak and standard time, and refilled off-peak. The dashed gold line is the roof array.
Active energy. In winter a kilowatt-hour moved from off-peak (R1.81) into the peak (R7.56) is worth nearly four times what it cost, after losses.
| Load | Pattern | Battery role |
|---|---|---|
| Frozen chambers | Around the clock, −25 °C | Held on island 1 |
| Chilled & fruit | Pull-down after intake | Island 2, peak shift |
| Defrost | Short spikes, four a day | Demand ceiling |
| Blast freezing | Day shifts, scheduled | Peak shifting |
| Docks & forklifts | Shift changes | Stays on the grid |
| Offices & services | Small | Sets the baseline |
One container on each cold board, with a transfer cabinet in front of it. Solaris™ EMS runs them all, under one point of responsibility.
Battery, PCS, cooling and fire protection in one 20 ft high-cube, delivering 400 V straight onto the LV board.
Grid and gensets ahead of a thyristor switch; the cold board and the battery behind it.
One controller runs every job against one state of charge and reports to your refrigeration SCADA.
The cell maker's tabulated 20-year test set at 90 % depth, by cycles a day. The cyan line is this cold store's duty.
To 70 % state of health at one cycle a day and 98 % depth. Measured on the cell, not assumed.
At this cold store’s duty of 1.46 cycles a day and 90 % depth. No augmentation in the term.
AC to AC, through the PCS. 94 % DC at the battery, beginning of life.
Solaris keeps 450 kWh in the batteries at all times for the cold boards. It is never spent on the tariff.
Each cold board gets its own PULSE cabinet and A2000. The gensets move onto the PULSE second source ports, so they join the island without a second break.
PULSE opens in half a cycle and the A2000 takes the voltage. Compressors, fans and controls run on.
With no break there is no compressor restart and no pull-down spike when the supply returns.
Solaris starts the gensets only when the battery runs low. They join through PULSE, with no second break.
When the supply returns, the PCS steers the island onto it; PULSE closes when both sides match.
Figures from the modelled cold store on this page, at an indicative turnkey cost. A site proposal replaces them with your own.
Turnkey supply, install and commissioning. You own the plant; we run it under a 15-year O&M and availability agreement.
We own and run the plant for a fixed monthly fee, for operators who keep storage off the balance sheet.
Start with the frozen board, where an outage costs most; add the chilled board’s pair the following year.
Illustrative case · composite site · not a client project
The eight-page business case, on the page: a composite third-party cold store in Cape Town’s Airport Industria, modelled half-hour by half-hour for a year on the City of Cape Town’s 2026/27 Large User tariff, then carried over fifteen years.
Download the business caseThe compressors run every hour of the year, and export fruit fills the chilled rooms from December to April. The bill is R34.5 m, and 32 % of the energy cost is bought in 15 % of the hours.
| Operation | Third-party cold store |
| Location | Airport Industria, Cape Town |
| Capacity | 32 000 pallets, chilled + frozen |
| Supply | 11 kV, City of Cape Town |
| Tariff | Large User TOU, medium voltage |
| Transformers | 2 × 1 600 kVA, 11/0.4 kV |
| Notified demand | 3 000 kVA |
| Recorded peak | 2 703 kVA, Feb |
| Power factor | 0.92 lagging |
| Roof solar | 1 200 kWp, no export |
| Standby | 2 × 1 000 kVA gensets |
| Annual bill | R34.5 m ex VAT |
Peak energy costs almost as much as all off-peak energy, in a seventh of the hours. The demand charge is set by one half-hour each month.
The frozen chambers set a floor that never moves.
Each column is a day from July 2026 to June 2027, each row a half-hour. The bright band in the early evening is the compressors at their hardest as the roof array fades and the day’s fruit is pulled down. Weekends show as darker stripes.
Cut the peak-window and demand charges and stop compressor trips when the supply drops, without touching throughput or set points.
Capital is approved on payback: the board’s hurdle is five years. Room for two containers in the service yard; the roof is already full.
The supply drops about 16 times a year. Each drop trips every compressor, and the pull-down when power returns can set a new demand peak.
The hottest afternoons and the fruit season push the demand to its peak in Feb. The dearest kilowatt-hours come from June to August, when a peak one costs 4.2 times an off-peak one.
Frozen and chilled rooms are 71 % of the peak-window load. They cannot be switched off, only supplied differently.
The same kilowatt-hour costs R7.56 in a July peak and R3.52 in a February one, so three months carry most of the energy value.
Heat and fruit intake set the highest half-hours in the cheap season. The battery has a different job in each half of the year.
Each cold board gets its own A2000 behind a PULSE cabinet: the frozen chambers on T1, the chilled and fruit rooms on T2. The gensets move onto the PULSE second ports; the roof array stays as it is.
| Battery | 2 × APEX A2000, 4 176 kWh LFP |
| Usable | 3 758 kWh at 90 % depth |
| Power | 2 × 1 000 kW, PCS inside, 400 V |
| Transfer | 2 × PULSE P1000, ≤ 10 ms |
| Reserve | 450 kWh held for the cold boards |
| Ceiling | Monthly, 1 680 – 2 030 kW |
| Control | Solaris™ EMS, reads roof PV and gensets |
| Footprint | ≈ 26 × 12 m of the service yard |
| Option | Rating | NMD after | Cycles / yr | Gross saving | Payback | NPV |
|---|---|---|---|---|---|---|
| 1 × A2000 + PULSE | 1 MW / 2.1 MWh | 2 400 kVA | 483 | R2.3 m | 4.1 yrs | R10 m |
| 2 × A2000 + PULSE ◆ | 2 MW / 4.2 MWh | 2 200 kVA | 534 | R4.5 m | 3.8 yrs | R20 m |
| 3 × A2000 + PULSE | 3 MW / 6.3 MWh | 2 100 kVA | 391 | R5.0 m | 4.9 yrs | R16 m |
One A2000 covers one cold board and half of each peak window. The second doubles the saving for about the same payback and covers both islands. A third adds R0.5 m a year but cycles less and pays back more slowly. ◆ Selected.
Solaris empties the batteries through the morning peak, refills them in standard time under the month’s ceiling, empties them again from 18:00 and tops them up off-peak, never below the cold boards’ reserve.
Dashed: the store’s draw net of the roof array, before the plant. White: grid draw with it. Cyan: energy the batteries supply. Grey: energy bought above the old draw to recharge, at off-peak or standard prices, under the month’s ceiling. The lower strip is battery power (±2 MW) and the state of charge.
Most of the saving is energy moved out of the peak windows, worth most in winter. A demand ceiling every month, a better power factor and a lower notified demand add the rest.
| Value stream | How it is earned | Per year |
|---|---|---|
| Peak energy shifted | Peak kWh bought at off-peak and standard prices instead, net of 12 % losses | R3.72 m |
| Demand ceiling | The month’s highest half-hour held down: 2 496 → 1 964 kVA on average | R0.48 m |
| Power factor | PCS holds 0.96 at the meter, so the same kW bills fewer kVA | R0.09 m |
| Notified demand | NMD renewed at 2 200 kVA: the network capacity charge | R0.20 m |
| Total | Per year at FY2027/28 prices | R4.50 m |
Bills are rebuilt line by line from the City of Cape Town Large User time-of-use tariff, medium voltage: active energy by period and season, the demand charge on the month’s highest half-hour in peak or standard time, the network capacity charge on the notified maximum demand and the monthly service charge. The notified-demand saving starts in year two. Avoided diesel and protected stock are not counted.
The operator buys the plant turnkey and we run it. The saving rises with the tariff and eases as the cells age; O&M is the only cost after day one.
Even the worst single case leaves an NPV of R15 m.
On the cell maker’s measured curve at 1.46 cycles a day. The peak-shifting saving is cut in step with it; the demand saving needs power, and holds.
| Structure | Turnkey supply, install and commissioning |
| Ownership | The operator, from commissioning |
| O&M | 15-year service agreement, AMPROTEQ |
| Availability | ≥ 97 %, measured monthly |
| Capacity | Tested yearly against the measured curve |
| Augmentation | None needed in the term |
| Monitoring | Solaris, 24 / 7, alarms to the plant room |
| Alternative | Service agreement: fixed monthly fee |
Both PULSE cabinets open in half a cycle and the A2000s take the cold boards. The gensets start only if the batteries run low, and join with no second break.
Blast freezing and the docks stop, defrost is held and the roof inverters trip. Both cold boards run on as islands on stored energy, with 1 206 kWh from the gensets at the end; inside the window the dashed line is those boards alone. The cost: most of that evening’s peak shift.
| City approval | Lodged at order; no export, to NRS 097-2-1 |
| Tariff changes | Solaris re-optimises to the new clock |
| Cell ageing | Measured curve; reserve and ceiling hold in year 15 |
| Fire | Gas detection and clean-agent suppression in each A2000 |
Illustrative case on a composite site; not a client project and not an offer. Modelled with the City of Cape Town 2026/27 tariff book (Large User TOU, medium voltage), PVGIS (SARAH3) yield for Cape Town and APEX A2000 and PULSE P1000 ratings. The outage pattern, escalation beyond 2027/28, the installed cost and all site data are assumptions.
Backup & islandingKeep critical loads running through load-shedding and network faults.Read more →Peak shiftingShift load out of Eskom Megaflex and Miniflex peak windows.Read more →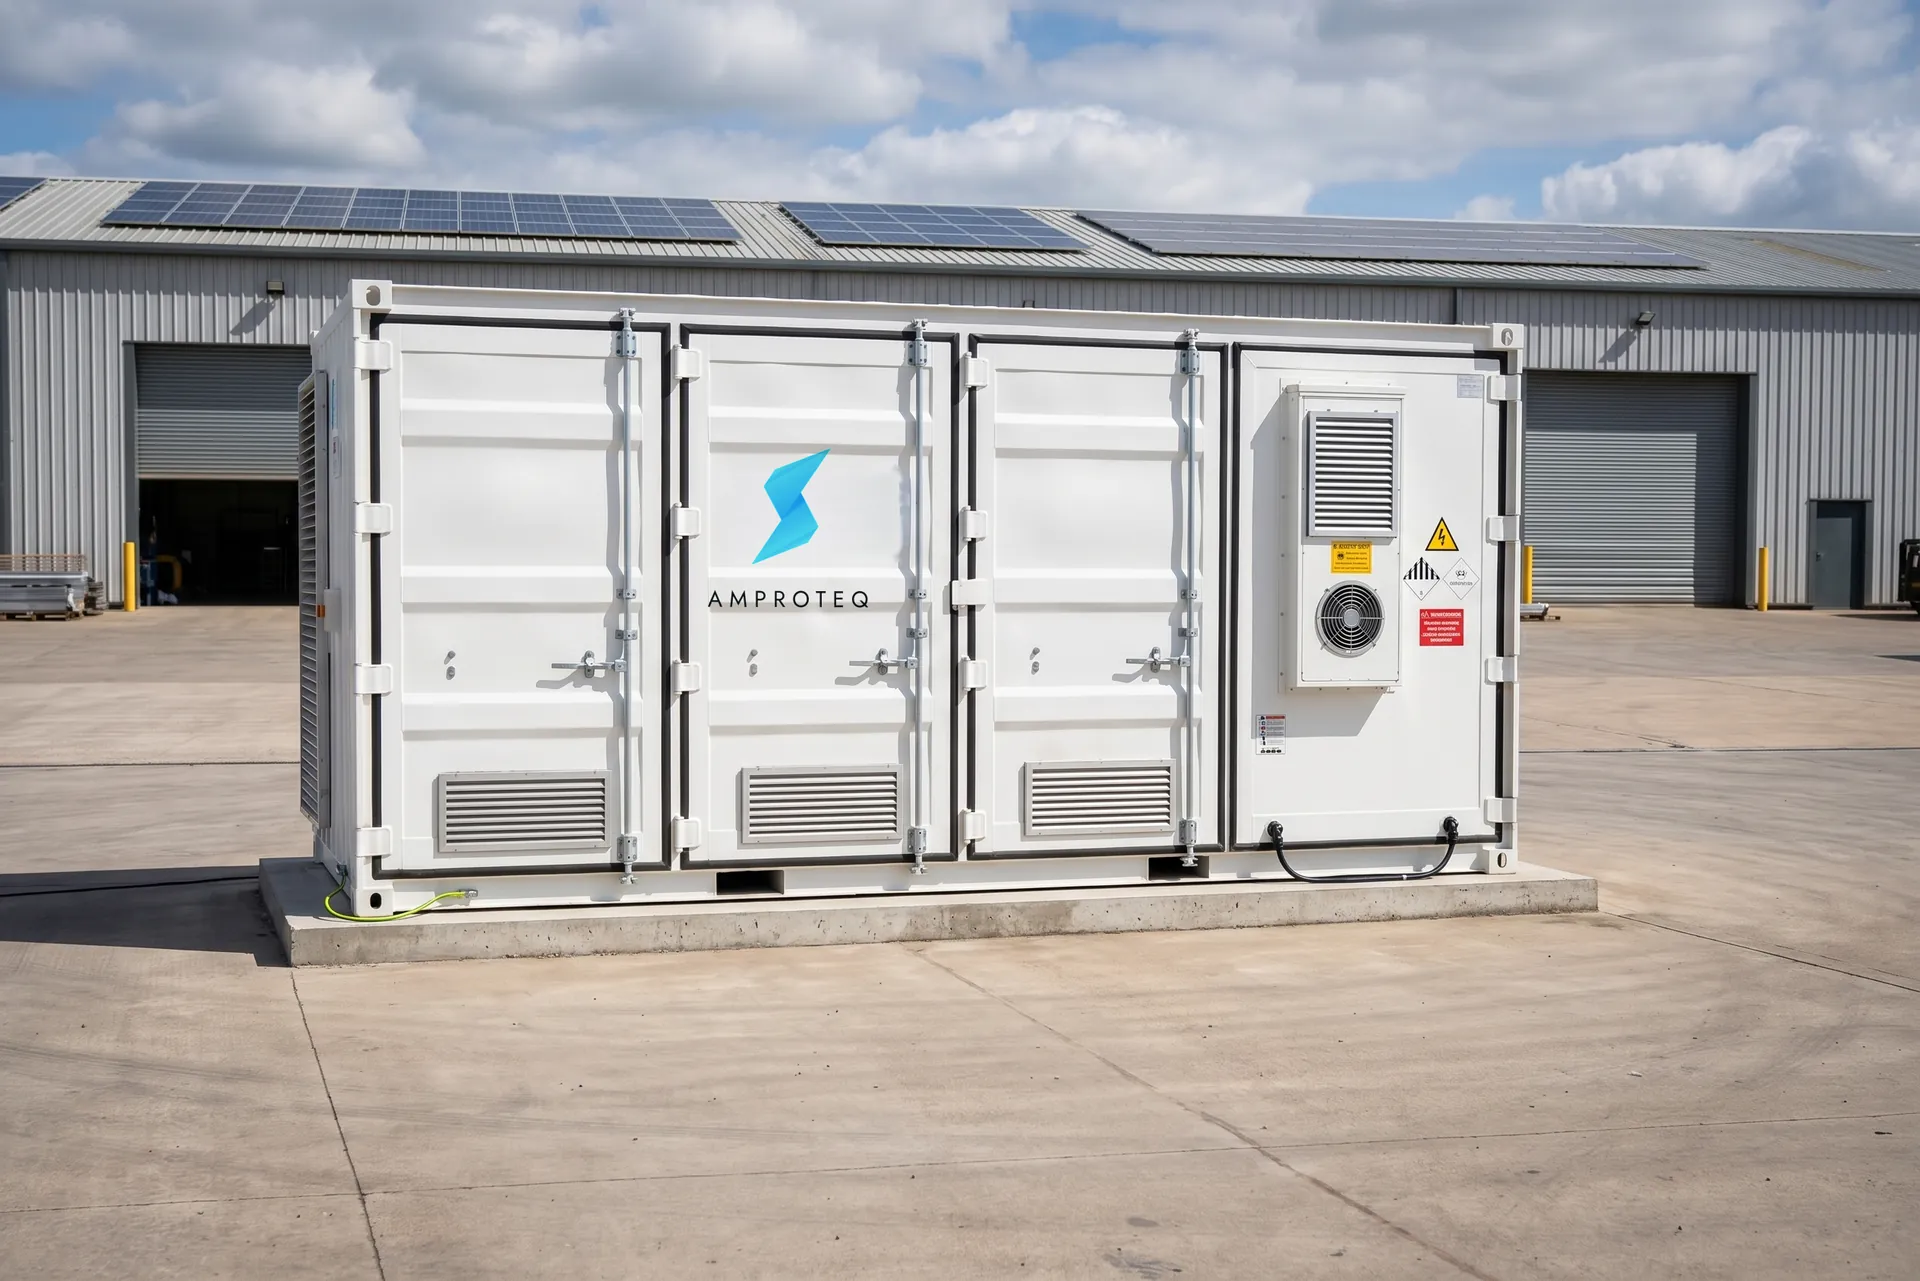 NMD reductionUse battery storage to hold demand under your notified maximum demand, avoid excess-demand charges and lower NMD at renewal on large-power-user tariffs..Read more →
The brief is the four-page case for storage at a cold store. The case study runs the numbers on a modelled chilled and frozen store in Cape Town, half-hour by half-hour, on the City’s 2026/27 Large User tariff at 11 kV.


Illustrative case · composite site · not a client project
Figures in both documents are modelled on the City of Cape Town’s 2026/27 Large User time-of-use tariff and indicative costs. A site proposal replaces every one with numbers from your own data.
Twelve months of interval data, your tariff schedule and your notified maximum demand are enough for a first sizing and an indicative capex, within five working days, at no cost.