Peaks
A flat load, billed at peak
IT halls run around the clock, so the campus buys as much energy in the peak windows as at night, at several times the price.
 AMPROTEQ
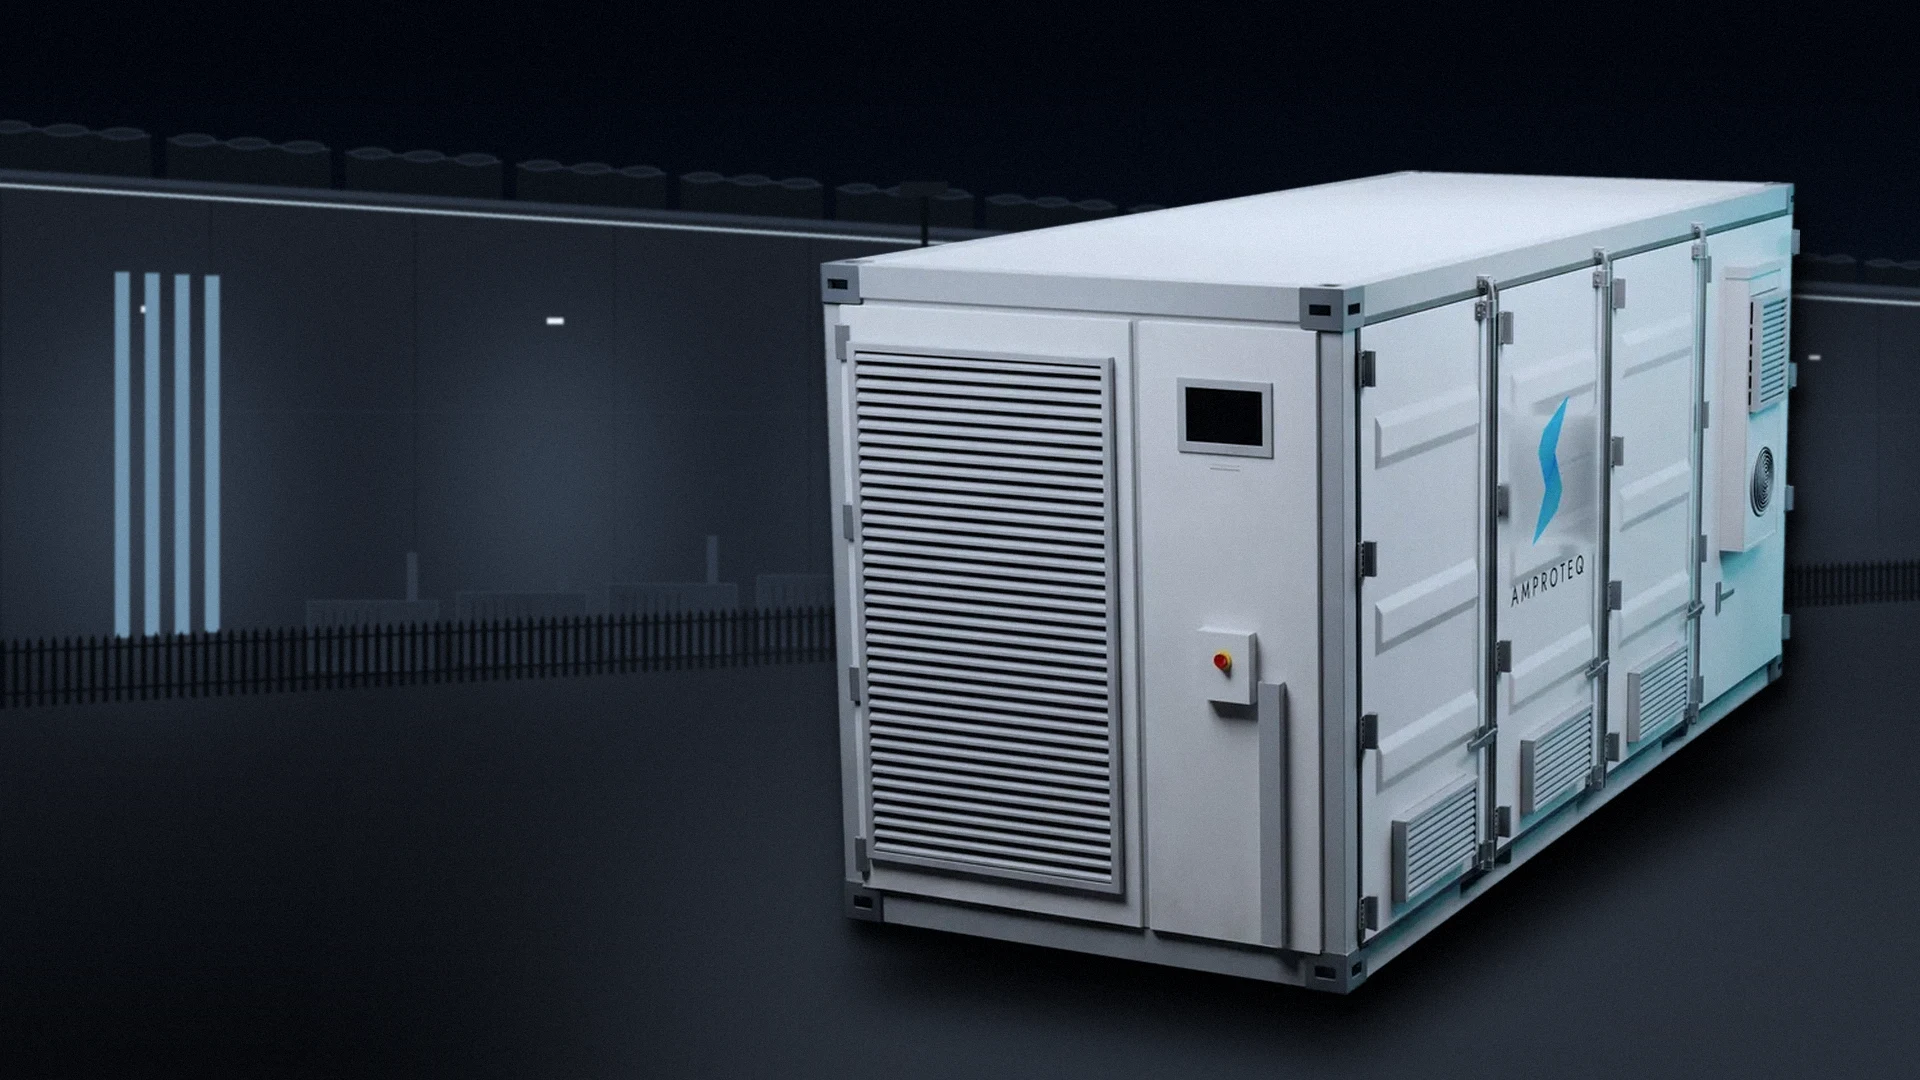
A data centre buys power every half-hour of the year. Storage takes the campus out of the peak windows, holds its demand under the ceiling and shares the load with the standby sets when the grid goes. The UPS stays as it is.
IT halls run around the clock, so the campus buys as much energy in the peak windows as at night, at several times the price.
Chillers push demand up in the afternoon heat, and one hot half-hour sets the demand charge for the month.
Each new hall adds one or two megawatts against a notified demand the utility is slow to raise.
| Systems | APEX A5000 blocks (5 MWh, 20 ft) with NEXUS N2500 MV skids |
| Connection | 22 kV on spare MV bays (10–35 kV) |
| Duration | About 2 hours, sized against the peak windows |
| Pairs with | The existing UPS and standby sets; PULSE on critical 400 V boards |
| Commercial model | Purchase; under four years simple payback in the modelled case |
Every configuration is sized from the site's own interval data and tariff; this is a starting point, not a quote.
The four-page sector brief, on the page: what a campus pays for in Eskom’s peak windows and on its notified demand, the system we connect at 22 kV beside the UPS, the option that keeps the cooling running through a transfer, and what it returns.
Download the flyerThe IT load is flat, so a data centre buys as much energy in the peak windows as at night. The battery earns in that gap, and in the demand the cooling plant no longer sets.
The white line is grid draw with a 10 MW / 20 MWh plant: lower through both peak windows, refilled at midday and overnight, never above the 17.4 MW ceiling.
Active energy, transmission zone 0. Plus R62.55/kVA a month on the notified demand and R26.29/kVA a month on the highest chargeable half-hour. A kilowatt-hour moved from off-peak (1.20) into a winter peak (7.20) is worth about five times what it cost, after losses.
| Load | Pattern | Battery role |
|---|---|---|
| IT halls | Flat, 24 / 7, growing | Peak shifting |
| Cooling plant | Afternoon heat | Demand ceiling |
| UPS | Milliseconds to minutes | Stays as it is |
| Standby sets | Hours, on an outage | Run lighter, burn less |
| New halls | Steps of 1 – 2 MW | Room under the NMD |
The UPS keeps doing what it was designed for. The battery works upstream, at 22 kV, on the bill every day and beside the standby sets when the grid goes.
Liquid-cooled LFP in one 20 ft high-cube. Four sit on two 22 kV bays in the case study.
Converters, step-up and MV switching on one skid, matched one-to-one to the A5000.
One controller runs every job against one state of charge and reports to your BMS.
Nothing in the critical path changes: the UPS still holds the IT load through the transfer and the sets still start on every outage. The battery adds a fourth layer that shortens the sets’ work, and on critical 400 V boards PULSE keeps pumps and air handlers turning through the switch.
The UPS carries the IT load through a transfer; the cooling plant usually is not on it. An A2000 behind a PULSE on the mechanical board closes that gap.
PULSE moves the mechanical board to the battery in ≤ 10 ms. Pumps and air handlers keep chilled water and air flowing while the sets start.
The cooling board never drops, so there is no restart sequence while the halls are warming.
P500, P1000 or P2000 per mechanical board, with one or two A2000 systems behind it at 400 V.
Added on top of the 22 kV plant where the cooling design calls for it, and priced per board.
Figures from the modelled campus on this page, at an indicative turnkey cost. A site proposal replaces them with your own.
Turnkey supply, install and commissioning. You own the plant; we run it under a 15-year O&M and availability agreement.
We own and run the plant for a fixed monthly fee, for operators who keep storage off the balance sheet.
Start with two blocks on one bus section and add pairs as new halls are let and the next bay is free.
Illustrative case · composite site · not a client project
The eight-page business case, on the page: a composite 11.6 MW-IT colocation campus in Midrand, modelled half-hour by half-hour for a year on the real 2026/27 Megaflex tariff at 22 kV, then carried over fifteen years.
Download the business caseThe modelled campus runs every hour of the year. Its bill is R310 m, and 32 % of the energy cost is bought in 14 % of the hours.
| Operation | Colocation, four data halls |
| Region | Midrand, Gauteng |
| Supply | Two 22 kV feeders, Eskom direct |
| Tariff | Megaflex Me02N, zone 0 |
| IT load | 11.6 MW average, filling |
| Annual PUE | 1.32 |
| Notified demand | 20 000 kVA |
| Recorded peak | 19 639 kVA |
| Power factor | 0.95 lagging |
| Standby | 10 × 2 MW sets on the 22 kV bus |
| Annual energy | 134 GWh |
| Annual bill | R310 m ex VAT |
Peak energy costs about as much as all off-peak energy, in a seventh of the hours. It is the line the battery attacks first.
The IT halls set a floor that never moves. Cooling adds the swing, and the swing sets the demand.
Each column is a day from April 2026 to March 2027, each row a half-hour. There are no weekends and no shutdowns: the brighter afternoons are the cooling plant working through the Highveld summer, and the slow brightening across the year is new IT load as the halls fill.
Cut the cost of the peak windows without touching the UPS, the tier design or a single customer rack.
Capital is approved on payback. Two spare panels on the 22 kV board, one per bus section, outside the secure perimeter.
The recorded peak of 19 639 kVA sits within 2 % of the NMD, and the next hall would push the campus past it.
The IT halls draw the same at 03:00 as at 18:00, so the peak windows carry a full share of the load. The cooling plant adds the swing on top, and it peaks in the summer afternoons.
June to August carry the winter peak price: 44 % of the year’s peak cost sits in those three months.
About 78 % of the peak-window load is customer IT. It cannot be shifted or switched off, only supplied differently.
The same kilowatt-hour costs R7.20 in a June peak and R2.99 in a November one, so the value is concentrated in three months.
Cooling averages 2.2 MW in winter and 3.0 MW the rest of the year. The year’s highest half-hour falls on a hot summer afternoon.
Each 22 kV bus section takes two 2.5 MW / 5 MWh pairs. The plant sits upstream of every hall transformer and UPS, behind the Eskom meter, so the supply agreement and the critical path do not change.
| Battery | 4 × APEX A5000, 20 MWh LFP |
| Usable | 18 MWh at 90 % depth of discharge |
| Conversion | 4 × NEXUS N2500, 48 × 215 kW |
| Power | 10 MW, 11 MVA maximum |
| Connection | Two 22 kV bays, one per bus |
| Round trip | ≥ 88 % AC–AC |
| Control | Solaris™ EMS, to the BMS by IEC 104 |
| Footprint | ≈ 1 560 m² fenced yard |
| Option | Rating | 22 kV bays | Cycles / yr | Gross saving | Payback | NPV |
|---|---|---|---|---|---|---|
| 2 × A5000 | 5 MW / 10 MWh | 1 | 425 | R11.7 m | 2.8 yrs | R73 m |
| 4 × A5000 ◆ | 10 MW / 20 MWh | 2 | 365 | R21.9 m | 2.8 yrs | R140 m |
| 6 × A5000 | 15 MW / 30 MWh | 3 | 286 | R25.9 m | 3.5 yrs | R145 m |
Two blocks pay back as fast but leave half of each peak on the bill and earn R10 m a year less. Six blocks cannot refill at midday without crossing the 17.4 MW ceiling, so they cycle less and need a third bay. Four blocks fill both bus sections and earn the most per rand. ◆ Selected.
Solaris discharges through both peak windows and recharges at midday without crossing a 17.4 MW ceiling. In summer the chillers leave less room to recharge, so the plant cycles once and guards the ceiling.
Cyan: energy the battery supplies, so the campus does not buy it. Grey: energy bought to recharge, at off-peak or standard prices and never above the ceiling. In January the midday recharge is small, and Solaris spends it holding the line. The lower strip is battery power (±10 MW) and the state of charge. At weekends the battery is held full as reserve.
About 90 % of the saving is energy moved out of the peak. The lower notified demand adds the rest, or stays in hand as room for the next hall.
| Value stream | How it is earned | Per year |
|---|---|---|
| Peak energy shifted | Peak kWh bought at off-peak and standard prices, net of 12 % losses | R19.7 m |
| Notified demand | NMD renewed at 18 000 kVA: generation, network and transmission capacity | R1.6 m |
| Power factor | PCS holds 0.99 at the board; the high-season reactive charge falls away | R0.3 m |
| Network demand | Monthly peak in chargeable periods held under the ceiling | R0.2 m |
| Total | R21.9 m |
Bills are rebuilt line by line from the Megaflex schedule (500 V – 66 kV, zone 0): active energy by period and season, legacy, subsidy and ancillary charges, capacity charges on the notified demand, network demand on the monthly chargeable maximum, reactive energy in the high season and daily service charges. The notified-demand saving starts in year two. Keeping the 20 MVA instead leaves about 1.5 MW of new IT load inside it. A wheeled solar contract does not reach the evening peak, so this case holds with or without one. Diesel saved is not counted.
The operator buys the plant turnkey and we run it. The saving rises with the tariff; O&M and one augmentation block are the only costs after day one.
Even the worst single case leaves an NPV of R111 m.
On the cell maker’s measured curve at 1.0 cycles a day. One more A5000 in year 5 keeps the fleet above 16.2 MWh for the term.
| Structure | Turnkey supply, install and commissioning |
| Ownership | The operator, from commissioning |
| O&M | 15-year service agreement, AMPROTEQ |
| Availability | ≥ 97 %, measured monthly |
| Capacity | Tested yearly; ≥ 16.2 MWh usable |
| Augmentation | One A5000 in year 5, in the plan |
| Monitoring | Solaris, 24 / 7, to the BMS and NOC |
| Alternative | Service agreement: fixed monthly fee |
The UPS and the sets keep their roles. On a published outage Solaris holds the charge, and once the sets have taken the 22 kV bus the battery carries part of the campus beside them.
The battery carries 8.4 MW, 57 % of the campus, and the sets carry 6.2 MW. All ten sets stay on line, as the site’s rules require; each runs lighter. That saves about 4 100 litres of the 10 500 burned with the sets alone (generic set fuel curve). A two-hour curtailment of 3 MW needs no set at all.
| Layer | Carries | In this plant |
|---|---|---|
| UPS | The IT load, from the first millisecond | Unchanged |
| Standby sets | The whole campus, for as long as there is fuel | Start on every outage, as now |
| APEX + NEXUS | Shares the campus load with the sets; carries curtailment alone | New |
| Grid-code or protection change | Studies before order; settings agreed with your engineer |
| Work near live halls | Yard and cable outside the secure perimeter; change control |
| Cell ageing | Measured cell data; augmentation in the plan from day one |
Illustrative case on a composite site; not a client project and not an offer. Modelled with Eskom’s Schedule of Standard Prices 2026/27 (Megaflex, 500 V – 66 kV, zone 0) and APEX A5000 / NEXUS N2500 ratings. Tariff escalation beyond 2027/28, the installed cost, the set fuel curve and all site data are assumptions.
 Peak shiftingShift load out of Eskom Megaflex and Miniflex peak windows.Read more →
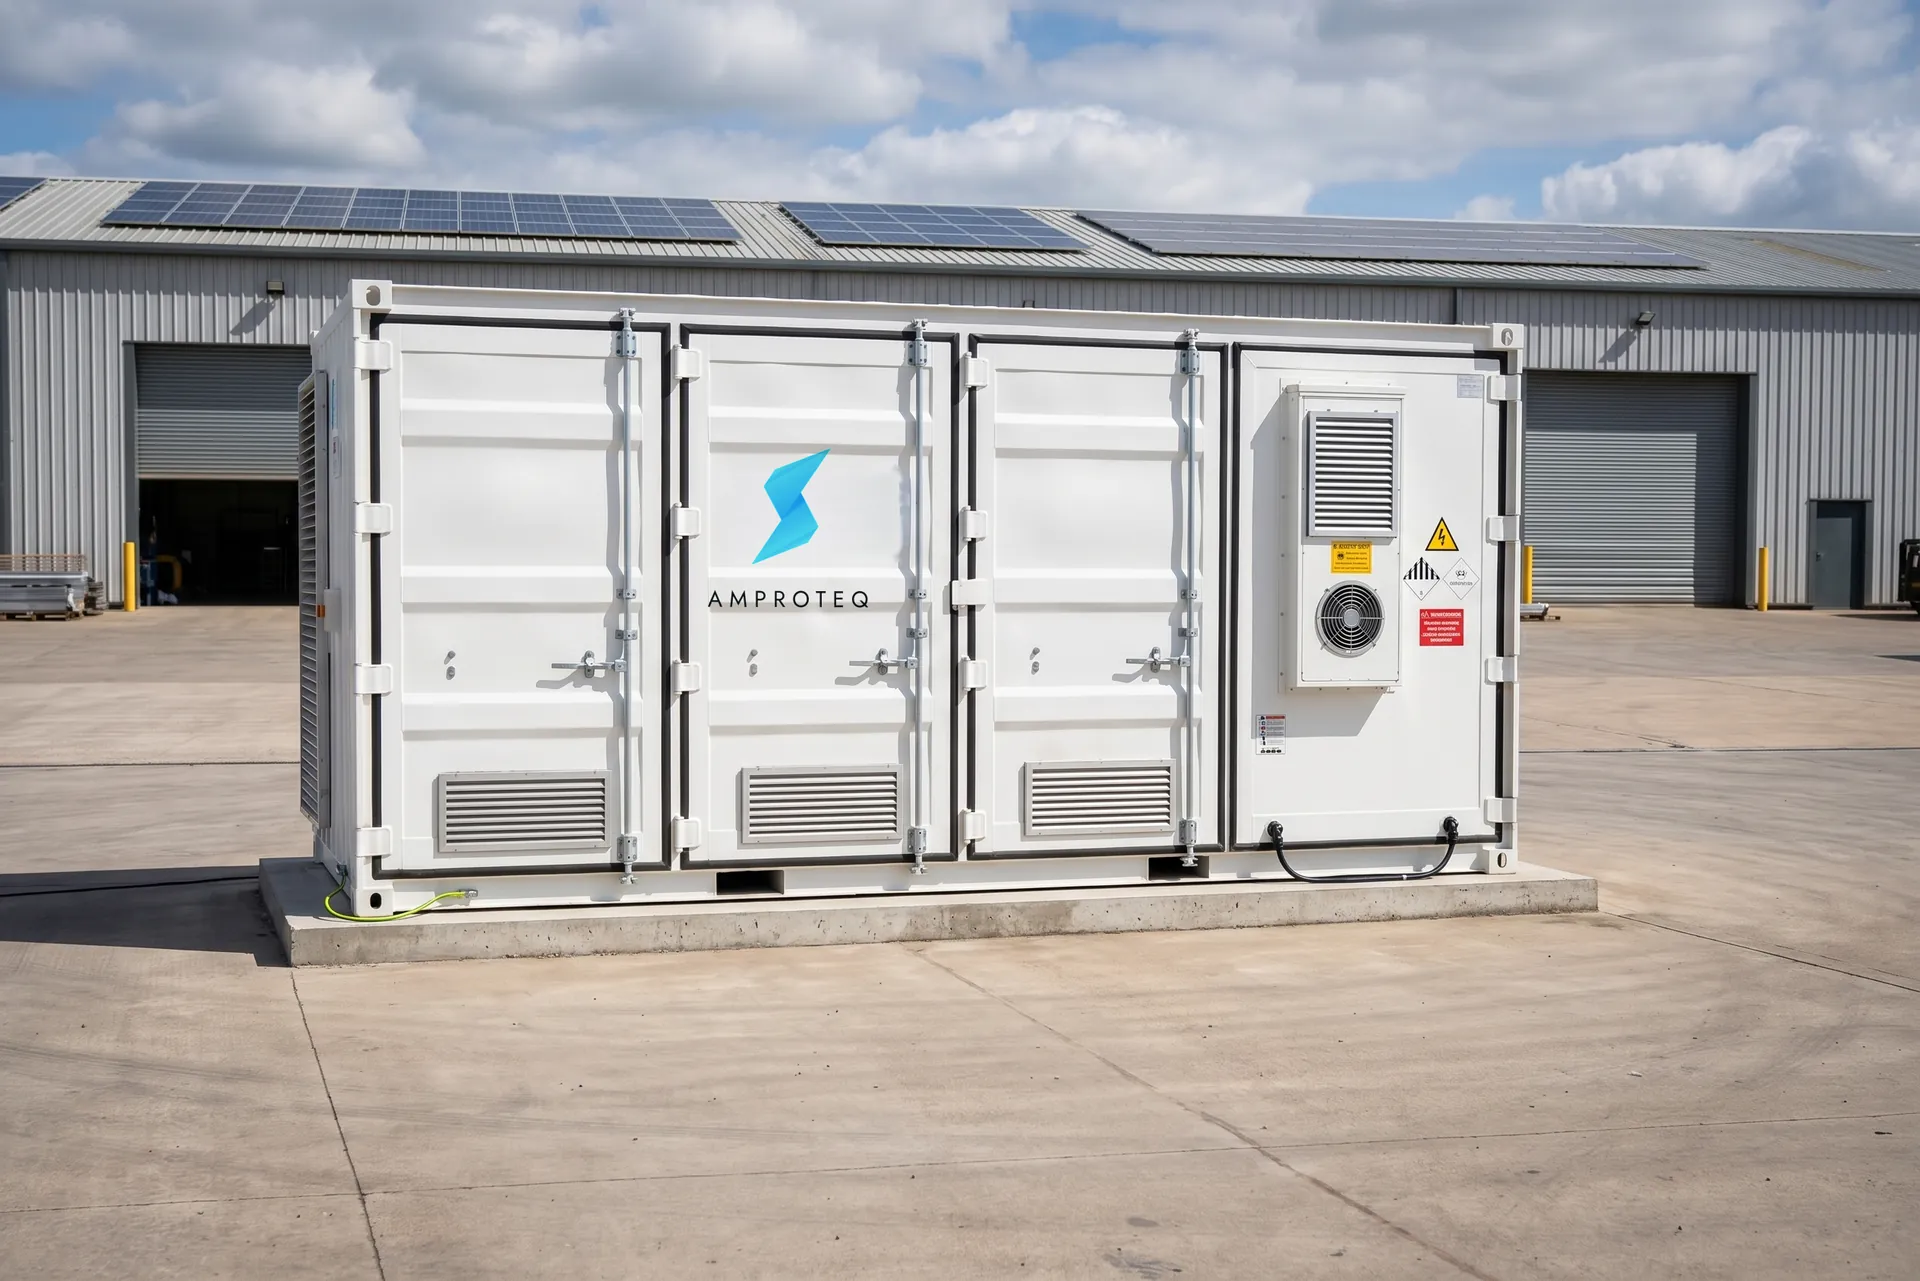 NMD reductionUse battery storage to hold demand under your notified maximum demand, avoid excess-demand charges and lower NMD at renewal on large-power-user tariffs..Read more →Backup & islandingKeep critical loads running through load-shedding and network faults.Read more →
The brief is the four-page case for storage beside the UPS. The case study runs the numbers on a modelled colocation campus, half-hour by half-hour, on the 2026/27 Megaflex tariff.


Illustrative case · composite site · not a client project
Figures in both documents are modelled on Eskom’s 2026/27 schedule and indicative costs. A site proposal replaces every one with numbers from your own data.
Twelve months of interval data, your tariff schedule and your notified maximum demand are enough for a first sizing and an indicative capex, within five working days, at no cost.